

Why do cumulative frequency graphs use upper class boundaries instead of midpoints?
The short answer
A cumulative frequency graph uses the upper class boundary because the running total counts every observation below that boundary when the intervals are written lower-inclusive and upper-exclusive.
For example, a point at (20, 12) means 12 measurements are below 20. Placing it at the midpoint of 10 to 20 would instead say that 12 measurements are below 15, which the grouped data cannot tell you.
Build the running totals before plotting
A class times 20 water-bottle refills. Let t be the refill time in seconds. The groups include their lower endpoint and exclude their upper endpoint, so a time of exactly 20 seconds belongs to the 20 ≤ t < 30 group.
- 0 ≤ t < 10 has 4 refills. The running total below 10 seconds is 4.
- 10 ≤ t < 20 has 8 refills. The running total below 20 seconds is 4 + 8 = 12.
- 20 ≤ t < 30 has 6 refills. The running total below 30 seconds is 12 + 6 = 18.
- 30 ≤ t < 40 has 2 refills. The running total below 40 seconds is 18 + 2 = 20.
Pair each total with the boundary it describes
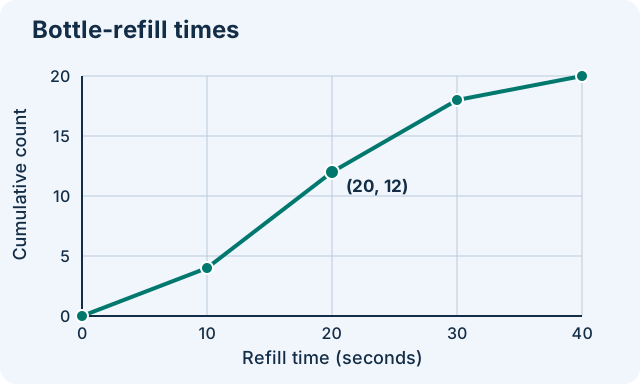
Start at (0, 0) because there are no observations below the first lower boundary. Then plot (10, 4), (20, 12), (30, 18), and (40, 20). The horizontal axis measures seconds. The vertical axis counts refills.
The chart joins the points with straight segments. The marked points give exact counts at the boundaries. Values read between those points are estimates because the original times within each group are unknown.
Choose the horizontal position from the graph type
A frequency polygon plots each group's own count at its class midpoint. The midpoint of 10 to 20 is 15, so that group's frequency polygon point is (15, 8). The midpoint represents the entire interval.
A cumulative frequency graph, also called an ogive, plots a running total at a cutoff. For the same group, the point is (20, 12). Before plotting, ask whether the vertical value answers ‘how many in this group?’ or ‘how many up to this cutoff?’
Read a count, a group size, and an estimate
To count refills below 30 seconds, read the height at 30. The answer is 18. To count refills from 20 seconds up to but excluding 30 seconds, subtract the running totals at the two boundaries. That gives 18 − 12 = 6.
For an approximate median, read across from half the total, which is 10. The count rises from 4 to 12 between 10 and 20 seconds. With straight segments, 10 is six-eighths of the way up that segment, so the corresponding time is 10 + (6/8) × 10 = 17.5 seconds. This estimate depends on how the points are joined.
Match the wording to the endpoints
With intervals written 10 ≤ t < 20, use ‘below 20’ to describe the running total at 20. If a table groups values as 10 < t ≤ 20, the running total at 20 includes observations equal to 20. Read the inequality signs before interpreting the point.
Some tables show rounded measurements as labels such as 10–19 and 20–29. When those labels represent measurements rounded to the nearest second, the shared boundary is 19.5 seconds, halfway between the two displayed limits. Use the boundaries supplied by the problem when they are given.
Practise with the same graph
Use the boundary totals first and check each result against the original groups.
- How many refills took less than 20 seconds? 12.
- How many refills took at least 30 seconds? 20 − 18 = 2.
- What point belongs to the frequency polygon for 20 ≤ t < 30? The midpoint is 25 and the group frequency is 6, so the point is (25, 6).
Put the boundary rule to work
Before drawing the next graph, label the horizontal axis with the measured quantity and the vertical axis with the count. Read one plotted point aloud as a sentence about the data to check both coordinates.