

Why do you divide frequency by class width to draw a histogram with unequal intervals?
The short answer
Divide frequency by class width so the area of each histogram bar represents its count. The resulting height is called frequency density. A bar that is twice as wide can have the same area at half the height.
The width is measured along the horizontal axis. Multiply that width by the height to recover the frequency. This lets you compare groups even when their intervals cover different ranges.
Give each observation the same share of area
Imagine that each observation contributes one square unit of area. A group of 20 observations needs an area of 20. If its interval is 10 units wide, a height of 2 makes that rectangle. A group of 15 observations spread across 5 units needs a height of 3. The shorter rectangle contains more observations because it covers twice the width.
This is why the calculation follows from the area formula. Frequency density = frequency ÷ class width. Frequency = class width × frequency density.
Draw a histogram from uneven groups
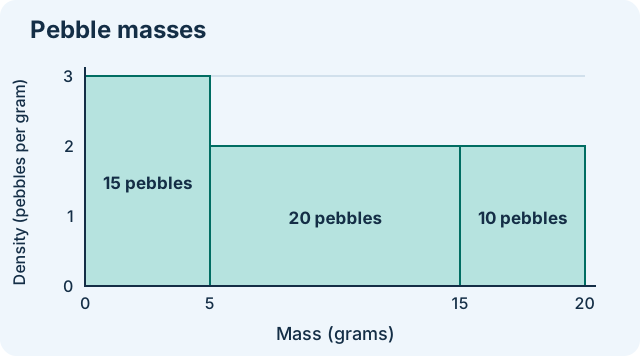
A class weighs 45 pebbles. The horizontal axis shows mass in grams. Each group includes its lower endpoint and excludes its upper endpoint, so a pebble weighing exactly 5 g belongs in the second group.
- 0 ≤ mass < 5 g has 15 pebbles. The width is 5 g and the density is 15 ÷ 5 = 3 pebbles per gram.
- 5 ≤ mass < 15 g has 20 pebbles. The width is 10 g and the density is 20 ÷ 10 = 2 pebbles per gram.
- 15 ≤ mass < 20 g has 10 pebbles. The width is 5 g and the density is 10 ÷ 5 = 2 pebbles per gram.
Read a count from a bar
For the 15 to 20 g interval, read the boundaries first. Its width is 20 − 15 = 5 g. The vertical axis gives a height of 2 pebbles per gram. Multiply to get 5 × 2 = 10 pebbles.
The two bars on the right have equal heights. The wider one has twice the area and contains twice as many pebbles. A boundary line at 15 g keeps the adjacent groups visible even though their heights match.
Choose the reading that matches the question
If a question asks which interval contains the most observations, compare the areas. In this example that is 5 to under 15 g, with 20 pebbles. If it asks which interval has the greatest frequency density, compare the heights. That is 0 to under 5 g, at 3 pebbles per gram.
When all intervals have the same width, dividing by that common width scales every height by the same factor. For equal-width histograms, a count axis is also common. Read the vertical label before deciding whether to read the count directly or multiply height by width.
Connect the histogram to running totals
The histogram stores one count per interval. To find the total below 15 g, add the first two bar areas. That gives 15 + 20 = 35 pebbles. A cumulative frequency graph would show that total at the cutoff of 15 g.
Try three checks
Use the units on both axes as a check. Grams multiplied by pebbles per gram gives pebbles.
- A group from 20 to under 28 g contains 12 pebbles. Its density is 12 ÷ 8 = 1.5 pebbles per gram.
- A 4 g interval has density 2.5 pebbles per gram. Its frequency is 4 × 2.5 = 10 pebbles.
- A bar covers 6 g and contains 18 pebbles. Another covers 9 g and contains 18. Their densities are 3 and 2, and both areas represent 18 pebbles.
Build confidence with widths and units
For the next histogram, write down the two class boundaries and their difference before using the height. If you are drawing the graph, check that each width times its density returns the original count.